The map below (Figure 1) shows the interpolation of peak ground acceleration – horizontal components (PGA_h) – recorded by the stations of RAN network during the May 29th event of Ml 5.8 (last accessed 30/05/2012).

Figure 1.
The map below (Figure 2) shows the interpolation of peak ground acceleration – vertical components (PGA_v) – recorded by the stations of the RAN network during the May 29th event of Ml 5.8 (last accessed 30/05/2012).
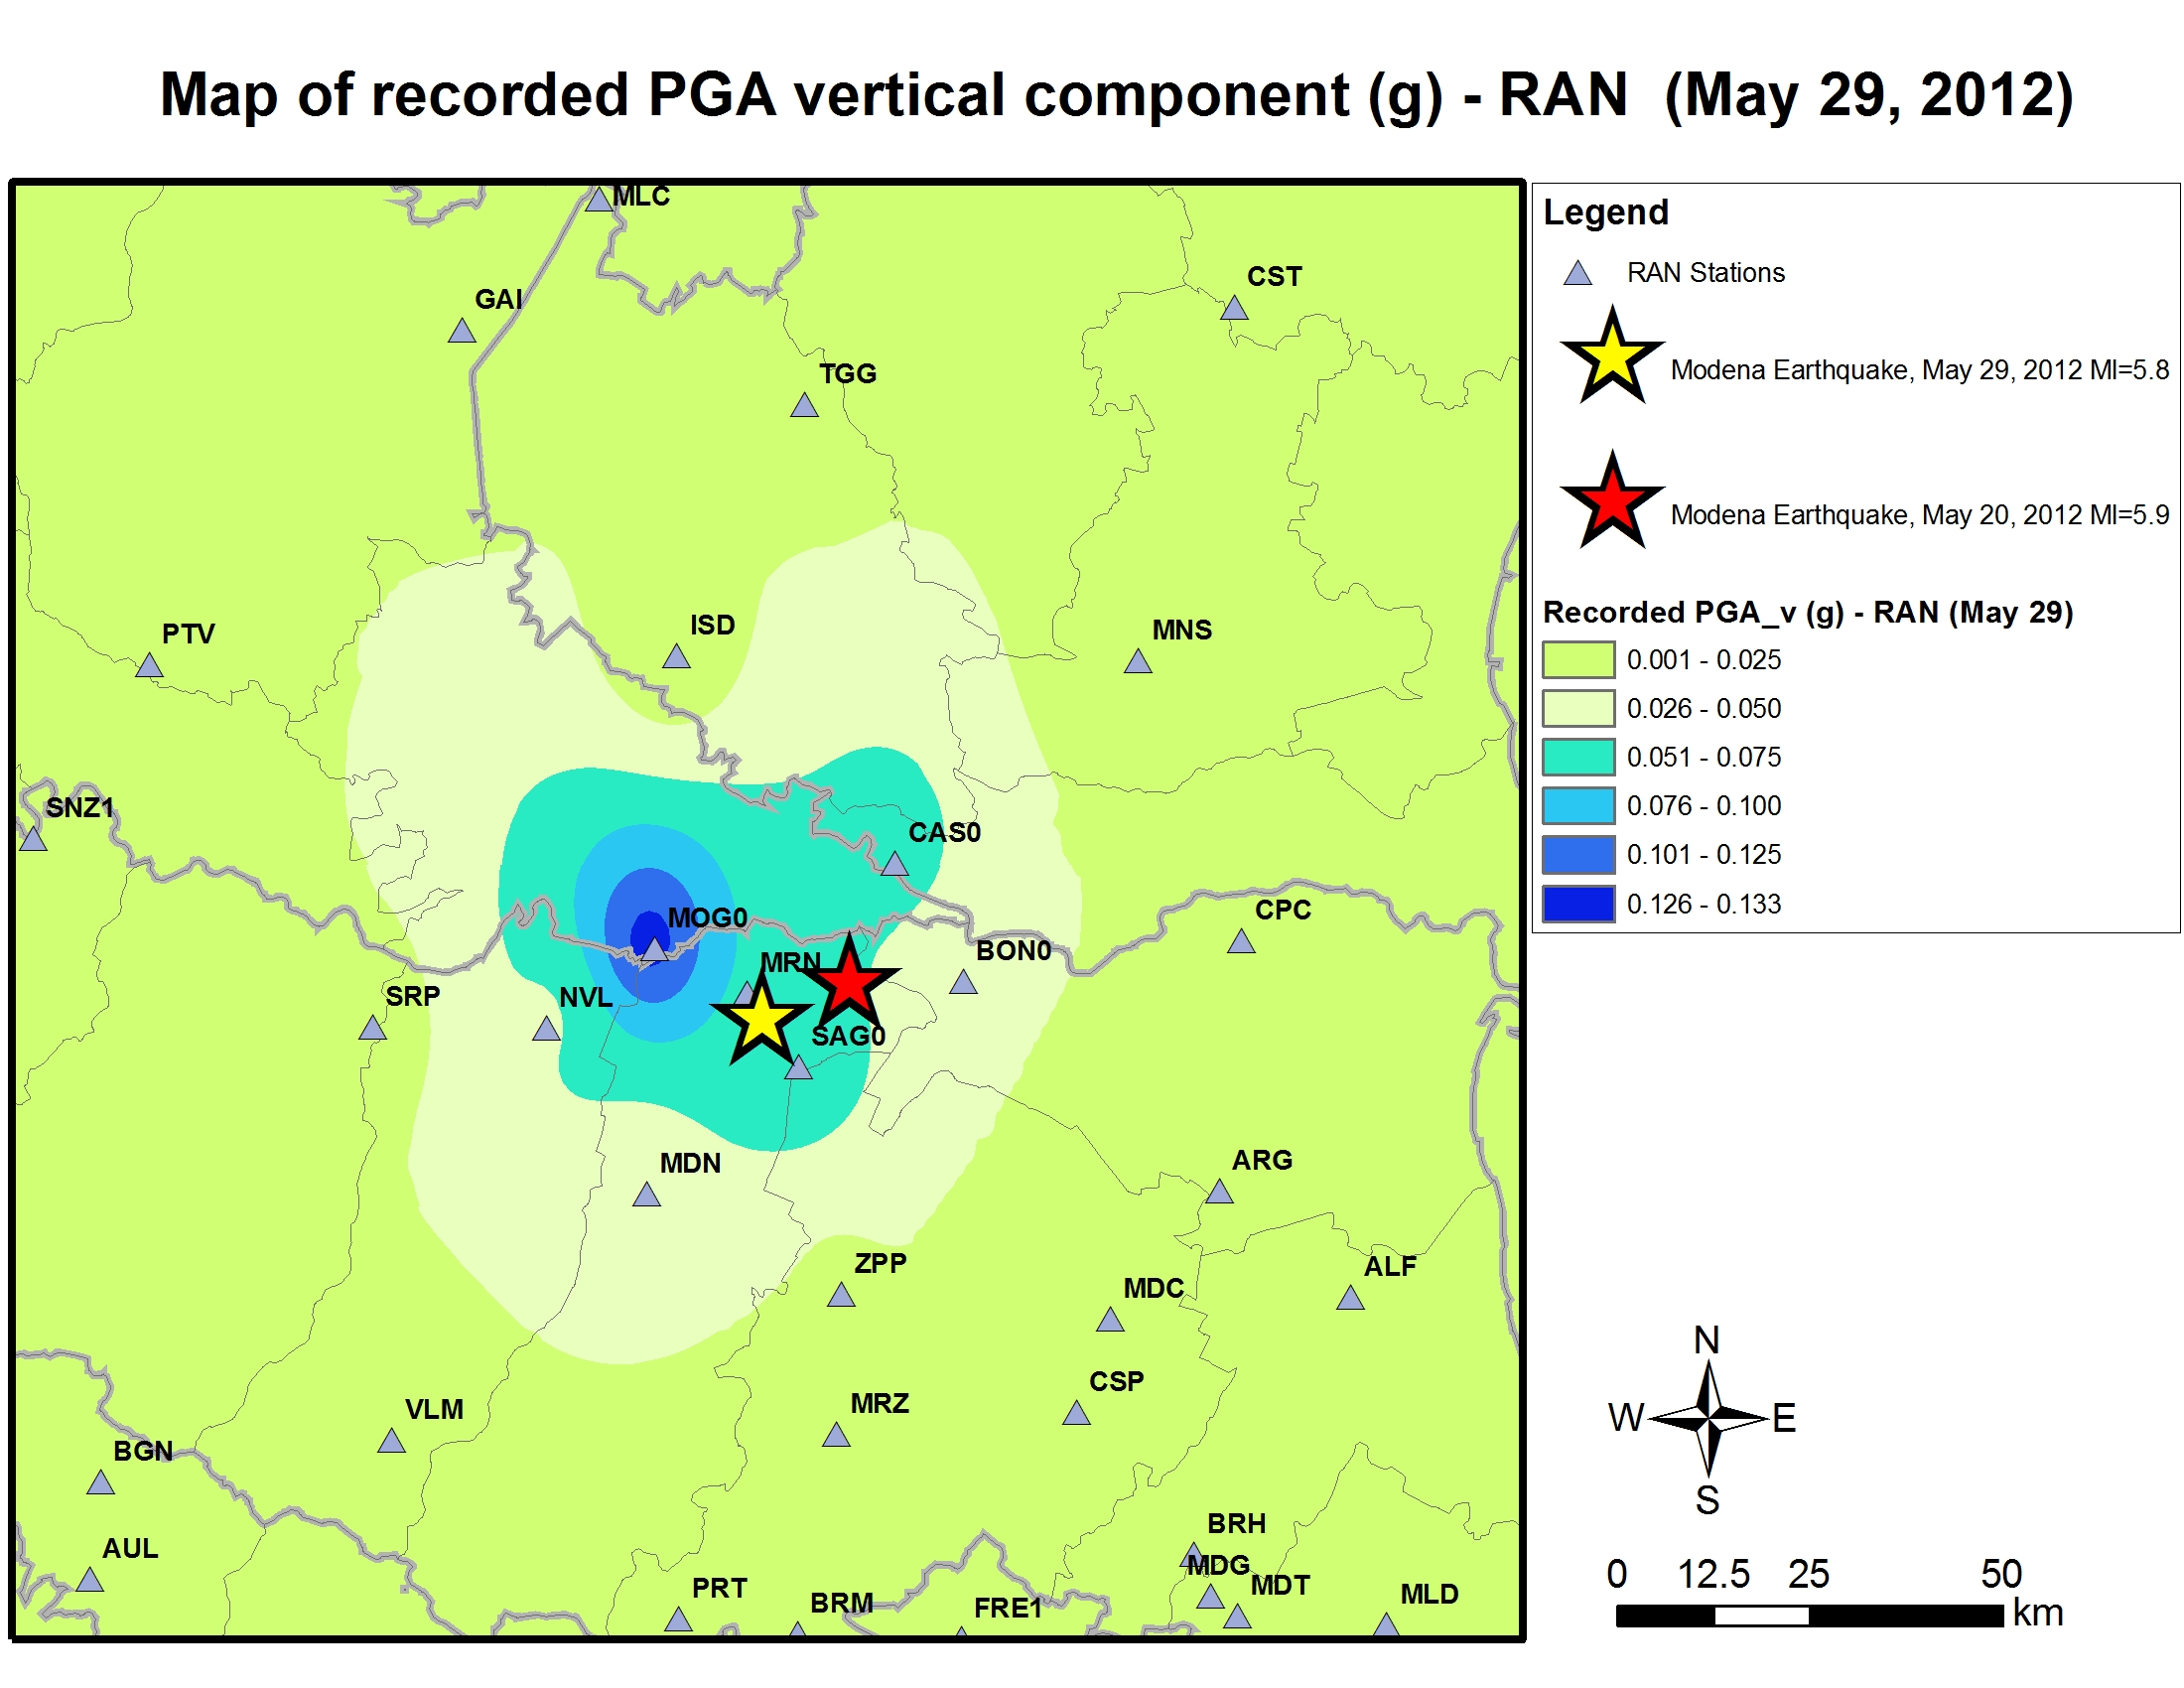
Figure 2.