The 2016 Kumamoto earthquake caused severe damage to Kumamoto area, Japan. Due to the shallow depth of epicenter, the particularly severe damage was caused in Mashiki town located 10km away from Kumamoto city. The earthquake consists of two strong ground motions (9:26pmJST on 4/14 and 1:25amJST on 4/16) and a series of smaller foreshocks and aftershocks.
 |
 |
| Figure 1. Map of Japan (Source: Google map) | Figure 2. Map of Kumamoto (Source: Google map) |
Overview of the ground motion of the earthquake occurred at 9:26pm(JST) on 4/14/2016
The first large ground motion hit the area at 9:26pm(JST), 4/14/2016. The magnitude of the earthquake was 6.5 and the depth of the epicenter was 10km[1]. The largest ground acceleration of 1580gal was measured at Mashiki town during this earthquake. This event was categorized into the foreshock after the larger ground motion on 4/16.
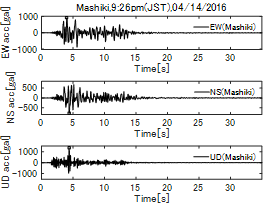
The ground motions and the peak ground accelerations measured at Mashiki town and Kumamoto city are shown below. They show that the strongest ground motion hit Mashiki town due to the shallow depth of the epicenter and the ground motion characteristics are different if we go 10km away from Mashiki town.
 |
 |
| Figure 2. Ground excitation at Mashiki during the foreshock. (Source:K-net,Kik-net[2]) | Figure 3. Ground excitation at Kumamoto during the foreshock. (Source:K-net,Kik-net[2]) |
| Table 1. Peak ground accelerations during the earthquake on 04/14/2016. |
 |
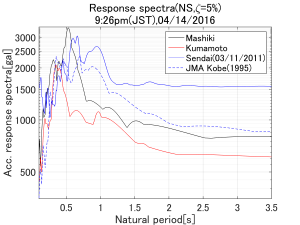
The acceleration and velocity response spectra of the foreshock at Mashiki town and Kumamoto city are shown below. For comparison purposes, response spectra of two large earthquakes in the past (The Great East Japan Earthquakes occurred on 3/11/2011 and the Southern Hyogo earthquake occurred on 1/17/1995) are shown at the same time. In Mashiki town, the acceleration response spectrum takes the maximum value of 3105gal at 0.27s in EW direction. In NS direction, the acceleration response spectrum takes the maximum value of 3416gal at 0.53s. Compared to the other earthquakes, the acceleration response spectra show the high peaks at short natural periods around 0.5s or less. At the same time, the spectra in EW direction shows the larger acceleration response in the range between 1s and 2s, which is said to be a critical range for civil structures. The peaks of the velocity response spectra are 241cm/s at 0.66s in EW direction and 247cm/s at 0.56s in NS direction. In addition to the large response at the periods around 0.5s, the velocity response in EW direction at the periods longer than 1s is also large.
 |
 |
| Figure 4. Acceleration response spectra (EW, 5% damping, source:JMA[1], K-net,Kik-net[2]) | Figure 5. Acceleration response spectra (NS, 5% damping, source:JMA[1], K-net,Kik-net[2]) |
 |
 |
| Figure 6. Velocity response spectra (EW, 5% damping, source:JMA[1], K-net,Kik-net[2]) | Figure 7. Velocity response spectra (NS, 5% damping, source:JMA[1], K-net,Kik-net[2]) |
Overview of the ground motion of the earthquake occurred at 1:25am(JST) on 4/16/2016
This earthquake was designated as the mainshock of the 2016 Kumamoto earthquake. The magnitude of the earthquake was 7.3 and the depth of the epicenter was 10km. The ground motion measured at Mashiki town and Kumamoto city during this earthquake are shown below. The peak ground accelerations are also tabulated below. The peak ground acceleration at Mashiki town exceeds 100gal again.
 |
 |
| Figure 8. Ground excitation at Mashiki during the mainshock. (Source:K-net,Kik-net[2]) | Figure 9. Ground excitation at Kumamoto during the mainshock. (Source:K-net,Kik-net[2]) |
| Table 2. Peak ground accelerations during the earthquake on 04/16/2016. |
 |
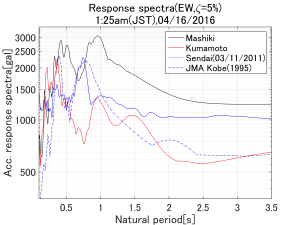
The acceleration and the velocity response spectra are shown below with the spectra of two previous earthquakes for comparison. In the acceleration response spectra of Mashiki town, the peak in EW direction was at 0.96s with the peak value of 3069gal and the peak in NS direction was at 0.31s with the peak value of 2236gal. The velocity spectra takes the maximum value of 405cm/s at 1.05s in EW direction and 235cm/s at 0.85s in NS direction. In this event, the response in the range of longer natural periods is large compared to the other earthquakes.
 |
 |
| Figure 10. Acceleration response spectra (EW, 5% damping, source:JMA[1], K-net,Kik-net[2]) | Figure 11. Acceleration response spectra (NS, 5% damping, source:JMA[1], K-net,Kik-net[2]) |
 |
 |
| Figure 12. Velocity response spectra (EW, 5% damping, source:JMA[1], K-net,Kik-net[2]) | Figure 13. Velocity response spectra (NS, 5% damping, source:JMA[1], K-net,Kik-net[2]) |
Other foreshocks and aftershocks
The table below shows the number of earthquakes measured after 9:26pm on 4/14/2016 for 9 seismic intensity levels[3]. The number of earthquakes shows that the series of earthquake do not end at all and we still need to be prepared for large aftershocks.
| Table 3. The number of earthquakes after 9:26pm(JST), 04/14/2016. (Source: JMA[3]) |
 |
References
[1]Japan Meteorological Agency (JMA) website (http://www.jma.go.jp/jma/menu/h28_kumamoto_jishin_menu.html, retrieved 04/20/2016).
[2]National Research Institute for Earth Science and Disaster Prevention (NIED) website (http://www.kyoshin.bosai.go.jp/, retrieved 04/20/2016).
[3]Japan Meteorological Agency (JMA), A report on the Kumamoto earthquake, (http://www.data.jma.go.jp/svd/eqev/data/2016_04_14_kumamoto/yoshin.pdf , retrieved 04/20/2016).